Pivot or No Pivot?
Crypto market analysis, technical analysis and top market events for 8/22 - 8/29
Technical: The crypto market volatility has compressed following last week’s sudden 10% drop. We traded in an incredibly tight range from $21,000 - $22,000, not being able to break out to either side until Friday. On Friday, renewed fears of a hawkish Fed led to a nasty sell-off. Bitcoin was in a bear flag, and with the negative news, it broke support and sent prices lower. The next significant level of support is $19,000. Ethereum looks much stronger on the daily chart, with prices still above the higher low it made before its run up to $2,000. We see support at $1,300 - $1,350, near its anchored VWAP and uptrend support line. With the merge coming up in approximately 3 weeks, this could be a good area to put on some Ethereum exposure.
Markets: On Friday, Fed Chair Powell came out extremely hawkish and direct and warned that the economy might see a slow down before inflation comes down. He re-emphasized the Fed’s commitment to bringing inflation down to the netural level and leaving rates high to ensure it does not get entrenched. The Fed pivot that the market has been looking for seems less and less likely. We are stuck in this macro news-driven environment until further notice. We expect prices could retrace to near the June lows for the S&P500 towards the end of this year. This would mean $15,000 for Bitcoin and other cryptos.
Recommendations: Markets are coming down to generational buy areas again. For those with cash, we would open Grid Bots for Bitcoin at $19,000 and $17,500 and Ethereum at $1,250 and $1,000. Aim to use around 40% of your portfolio size at these price levels. For structured products, we recommend BTC Dual Investment 11D duration with a $23,000 target price and USDT 11D duration with an $18,000 target price.
Important News
August 23: S&P Service PMI drops to 44.1 in August, the lowest since May 2020
August 23: S&P Manufacturing PMI drops to 51.3 in August, the lowest since July 2022
August 25: The improved second estimate put the nation’s GDP in the second quarter at -0.6%, an improvement over the -0.9% initially reported an expectation of -0.8%
August 26: The personal consumption expenditures price (PCE) index showed a year-over-year rise of 6.3% in July, down from 6.8% in June. This shows inflation is coming down in line with what we saw from the CPI numbers
August 26: The University of Michigan's consumer confidence index increased from 51.5 at the end of July to 58.2. This shows consumer confidence has rebounded, most likely due to falling oil prices
Technical
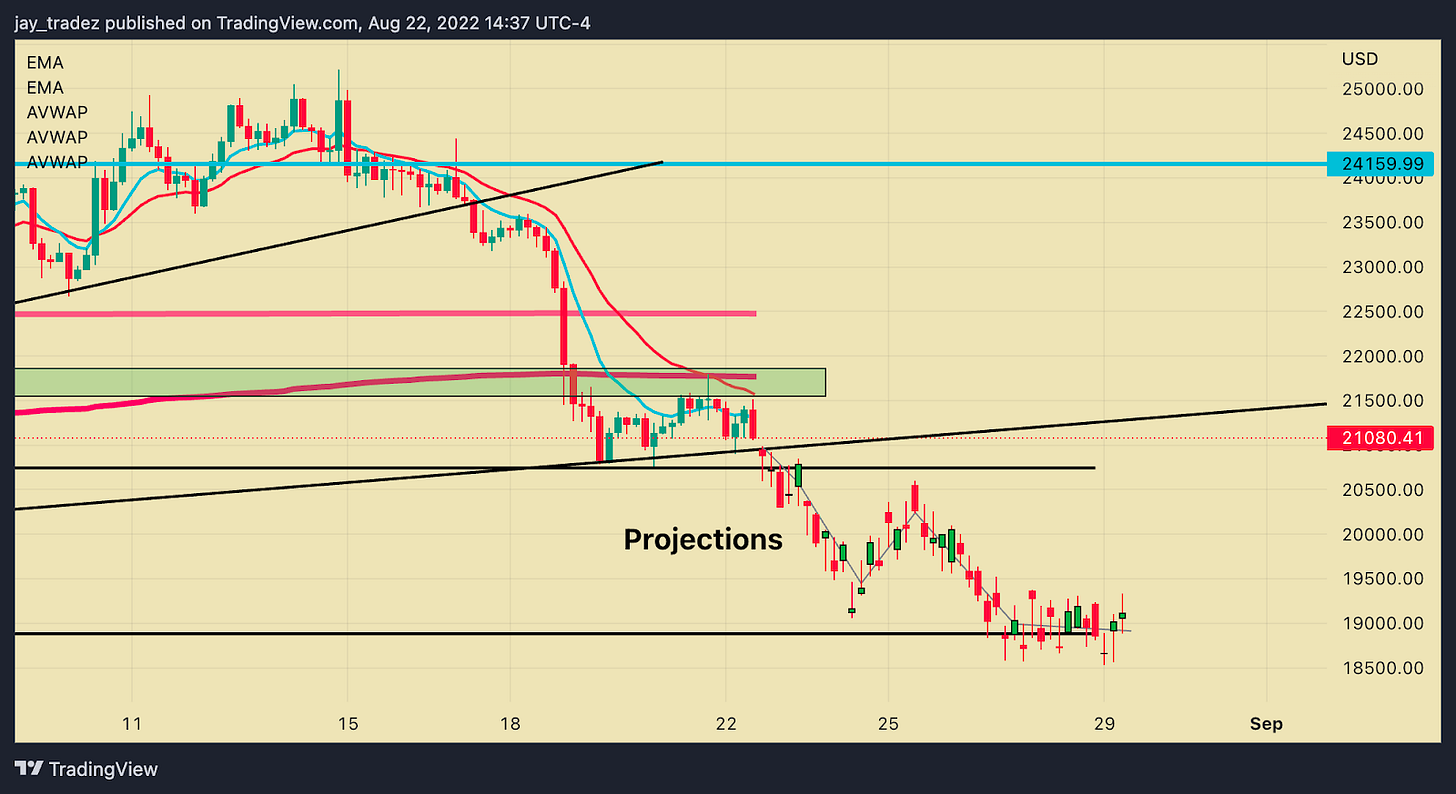
Here is what I wrote on Friday for this week's newsletter, but as you can see, it is outdated. “From a technical point of view, it looks like we are forming a formidable bear-flag pattern. As described last week, if the support is broken, we believe prices will decline quickly until the next support zone of $19,000.” Bear flags don’t always play out perfectly. I have seen many invalidated in my trading experience, but it usually plays out fully when they do play out. You can measure the approximate decline by measuring the % move in the “pole” of the flag. In this case, around 10%. That is how we came up with the $19,000 target, coinciding with the previous higher low support.
The bear flag is close to being finished, and $19,000, I believe, is a great place to buy the dip. However, with the way traditional markets performed on Friday, I wouldn’t be surprised to see us again visiting the YTD lows of ~$17,500. We got a hawkish Fed + no Fed pivot any time soon by the sound of Powell’s speech.
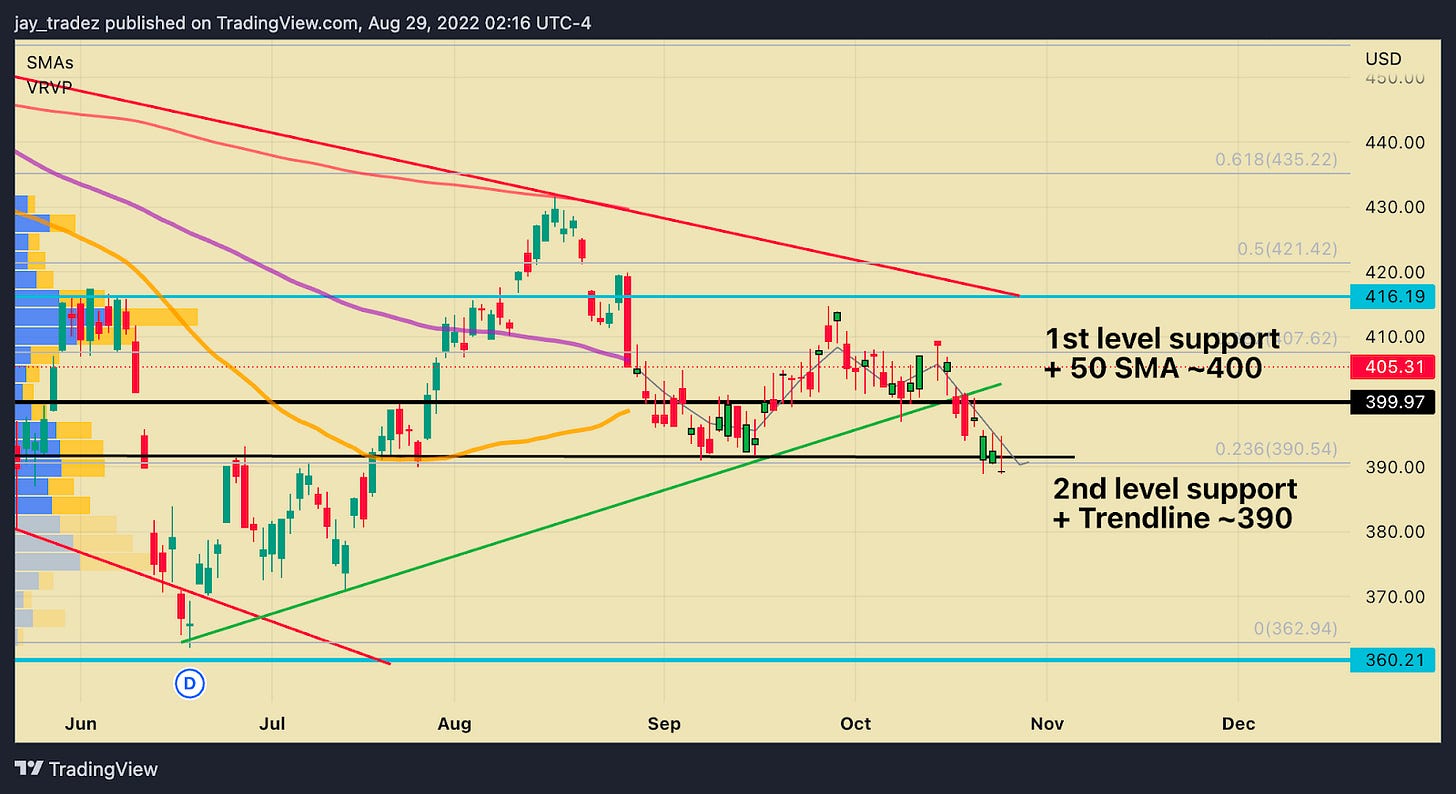
The market took a heavy turn Friday when Fed Chair Powell spoke with an extremely hawkish tone at the Jackson Hole Symposium. You can read more about our analysis of his statements in the fundamentals section below. The market was weak after gapping down last Monday, opening under the trendline support and the demand zone. We had a fake rally up towards the top of the demand zone, which often happens leading up to major market events such as the Jackson Hole Symposium. The run-up did not make any changes to the price outlook as it just tested previously broken support. After the speech, the S&P500 was sold off all day with no bounces as the market priced in longer than expected high interest and rate hikes. We will most likely continue down, but two levels of support to keep on watch are $400 and $390. I believe S&P will likely have a bounce near $390, bringing Bitcoin down to around the 52w low of ~$17,500 as an ultimate target. However, we will likely see some buyers come in around $400 as it coincides with the 50day MA (orange line).
Fundamental
We saw that the hash ribbons crossed upwards last week. When the hash ribbon crosses upwards, more miners are joining the network, and the total hash power increases. In the past, when this indicator occurred, we either moved to the upside within the next 1-2 months before moving lower, or it marked the bottom of a bear market. I am not saying this will occur again, but it has played out consistently in the last 9 occurrences over the past 8 years.
Funding Rates Keep Going Down
Funding rates are periodic payments either too long or short futures traders based on the difference between perpetual contract markets and spot prices. When the funding rate is positive, the price of the perpetual contract lies above the spot price. In contrast, negative funding rates imply that the perpetual price is lower than the spot price.
The recent BTC and ETH funding rates showed negative prints and just hit a 3-month low, indicating that the market still has pessimistic expectations for future price movements.
The Market Needs a Real Bottom
According to on-chain data from Glassnode, we’ve found the common trend of the last four bottoms: BTC holders<1 year period increased their appetite to buy at dips during market selloffs, and the HODL Wave finally showed upward trends.
However, HODL Wave from short-time holders is currently moving down, which means that short-term investors are dumping their positions instead of buying the dips. Therefore, we believe that the bottoming might not be over yet, and the market still has room to reach the real bottom.
Our Unique Opinion: The Pricing Logic has Changed
A Quick Take on Jackson Hole Symposium
From our point of view, Fed chair Jay Powell's speech mainly covered three details of last week's Jackson Hole Symposium:
1) The Fed will continue to raise interest rates, which might hurt the labor market.
2) Rate cuts will begin after the Fed maintains a high-interest rate for a longer period of time to ensure inflation stays down.
3) September rate hike will be between 50 bps and 75 bps.
At writing, the market is pricing in a higher probability of rate hikes by 75 bps in September.
Wall Street analysts and many crypto analysts have once predicted that the Fed will soon pivot to cutting rates. This outlook disappeared from those market expectations after Powell's speech. The market fell off the cliff, with the tech-heavy Nasdaq dropping nearly 4%.
Market Pricing Matrix
This time, we introduce our unique macro analyzing method, i.e. a 2*2 Pricing Matrix. The market once optimistically believed that the Fed would successfully curb inflation and gradually exit tightening with signs of recession, thus pricing the Fed to cut interest rates in mid-2023. In the "Recession + Low Inflation," the Fed will cut rates under this circumstance and thus benefit risk assets. However, after data showed that the U.S. economy is still resilient, recession expectations somehow disappeared. At the same time, the hawkish Fed speech in Jackson Hole last Friday made people realize that the Fed cannot exit tightening quickly, and the rate cut in mid-2023 was merely wishful thinking. This time, the market officially begins to price in "No recession + High inflation," which marks the worst-case scenario.
What to Expect Next?
We are waiting for more economic data until the end of this year to see whether the Fed can pivot from the recent aggressive rate hike plan of "No Recession + High Inflation" (hike until we break something) to "Recession + High Inflation" or "No Recession + Low Inflation" (will pause rate hikes). In those two cases, risk assets will take a breather from the beating it is taking from rate hikes.
Target Rate Probabilities Change Dynamically for 2023 March Meeting
Recommendation
BTC buy-the-dip
Congratulations to all readers who took our trading advice last week and bought the dip at around $20,500. This week, we recommend BTC buy-the-dip with a target price of $18,000 with 11 days expiration and an annualized yield of roughly 25%. This helps you automatically buy the dip and generate a high yield while waiting.
Structured Products | Generate yield
For those who participated in our idea last week, the BTC-based dual investment will expire in 4 days and has a low probability of reaching $24,000. Most likely, you will receive free yield. The USDT-based dual investment will expire in 4 days and has a very low chance of reaching $18,000.
We recommend buying the BTC dual investment for those who have not invested in structured products and holding BTC. The parameter we would use is an 11-day duration and a $23,000 target price. This would return 16.5% annualized yields.
For everyone holding USDT right now, we recommend USDT dual investment with BTC underlying. The parameter we would select is an 11-day duration and an $18,000 target price. The return on this investment is 28.7% annualized. We believe $18,000 is a great price to buy Bitcoin as it is ~20% below the realized price of ~$21,000. The bottom was marked in the previous bear markets when prices were ~25% under the realized price. This is a great spot to be adding BTC for hodling.
Swing Trading (Manual) | Hands-on Approach
The swing trade of the $21,500 support was stopped as prices cracked the $20,600 support.
Our short swing trade was executed last week as prices reached our entry point of $20,600. We reached a low of $19,500, approximately a 10% gain, but currently, prices are rebounding back to our entry. Remember, our target is $19,000, where I would take profits and stop out above $21,000.
Last week's projection
Current price
Risk-averse (Grid Bot) | 1 - 12 months
We recommend opening Grid Bot for BTC or ETH when prices reach $19,000, $17,500 for BTC or $1,300, $1,000 for ETH. For BTC, we recommend setting a lower limit of $12,000 and an upper limit of $30,000 with 100 grids. For ETH, we recommend setting a lower limit of $500 and an upper limit of $2,500 with 150 grids.
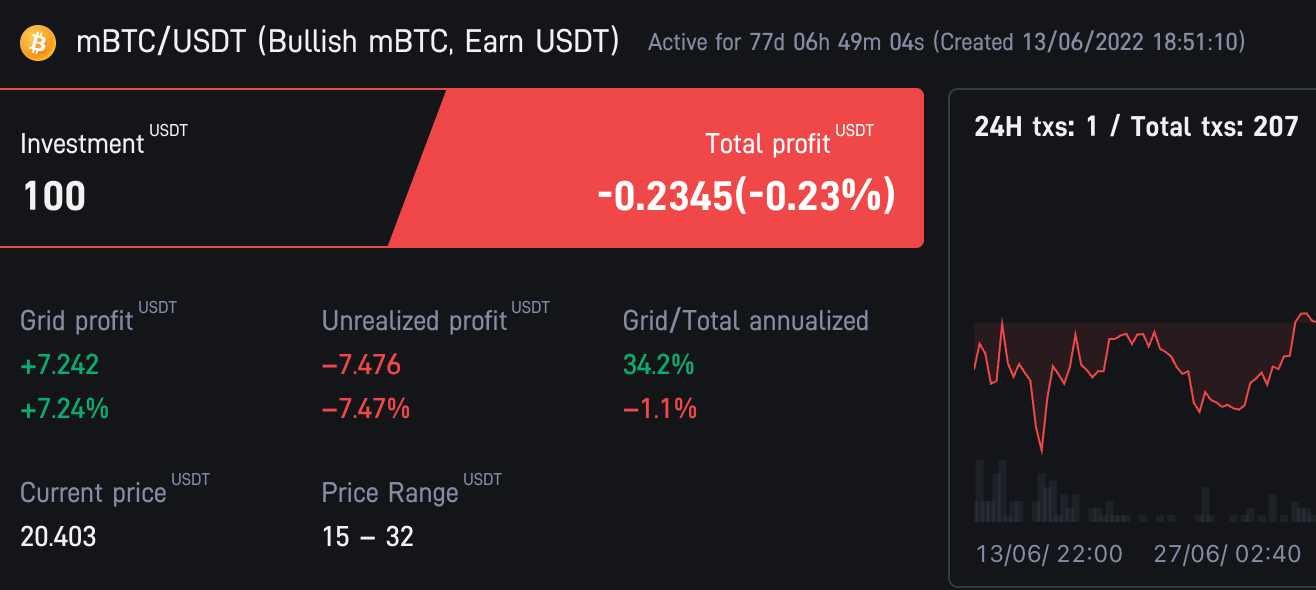
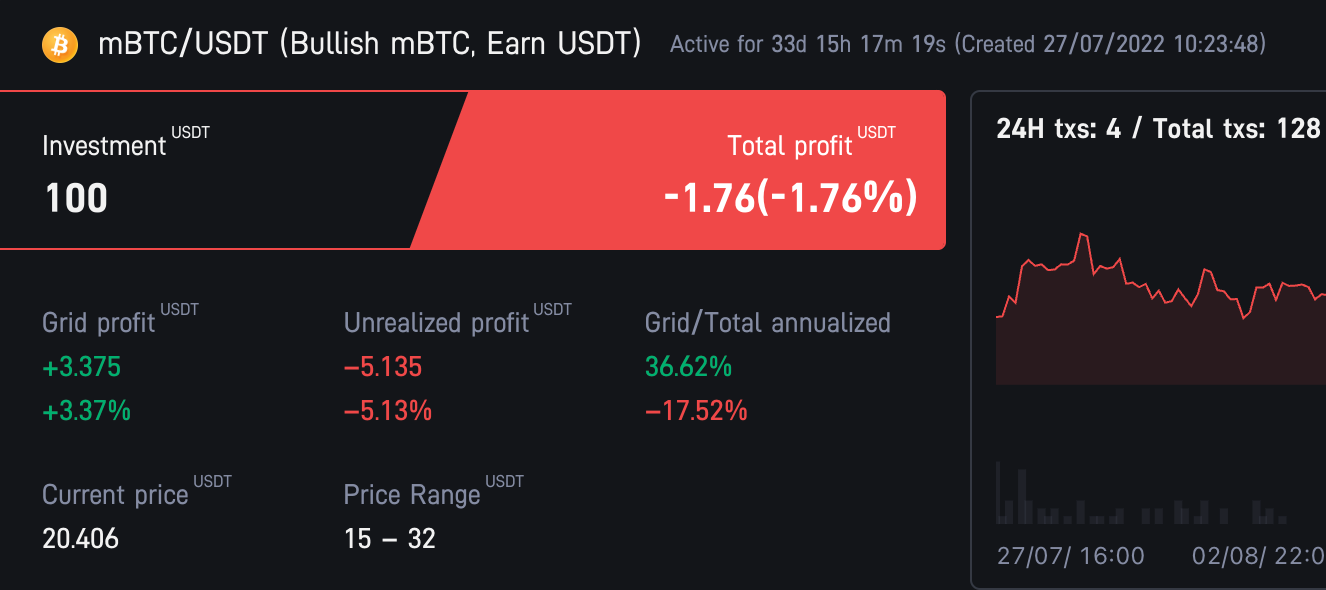
Our opened Grid Bot continues to arbitrage profits bringing our locked-in profit from 7.14% to 7.24%. However, as the market drops, our unrealized PNL has dragged to -7.4%.
Old Grid Bot
Bot started at $22,000 (7/25 newsletter alert)
Bot started at $23,000 (8/8 newsletter alert)
Hodler (Moon Bot) | 1 - 3 year time frame
For long-term holders you can take the same recommendations as the Grid Bots but instead of setting your own levels, open a BTC or ETH moon bot instead.


Thanks for the detailed analysis