Volatility Resumes
Crypto market analysis, Bitcoin technical analysis and top market events of 6/6 - 6/13
(Any views expressed below are the personal views of the author and should not form the basis for making investment decisions nor be construed as a recommendation or advice to engage in investment transactions.)
Summary
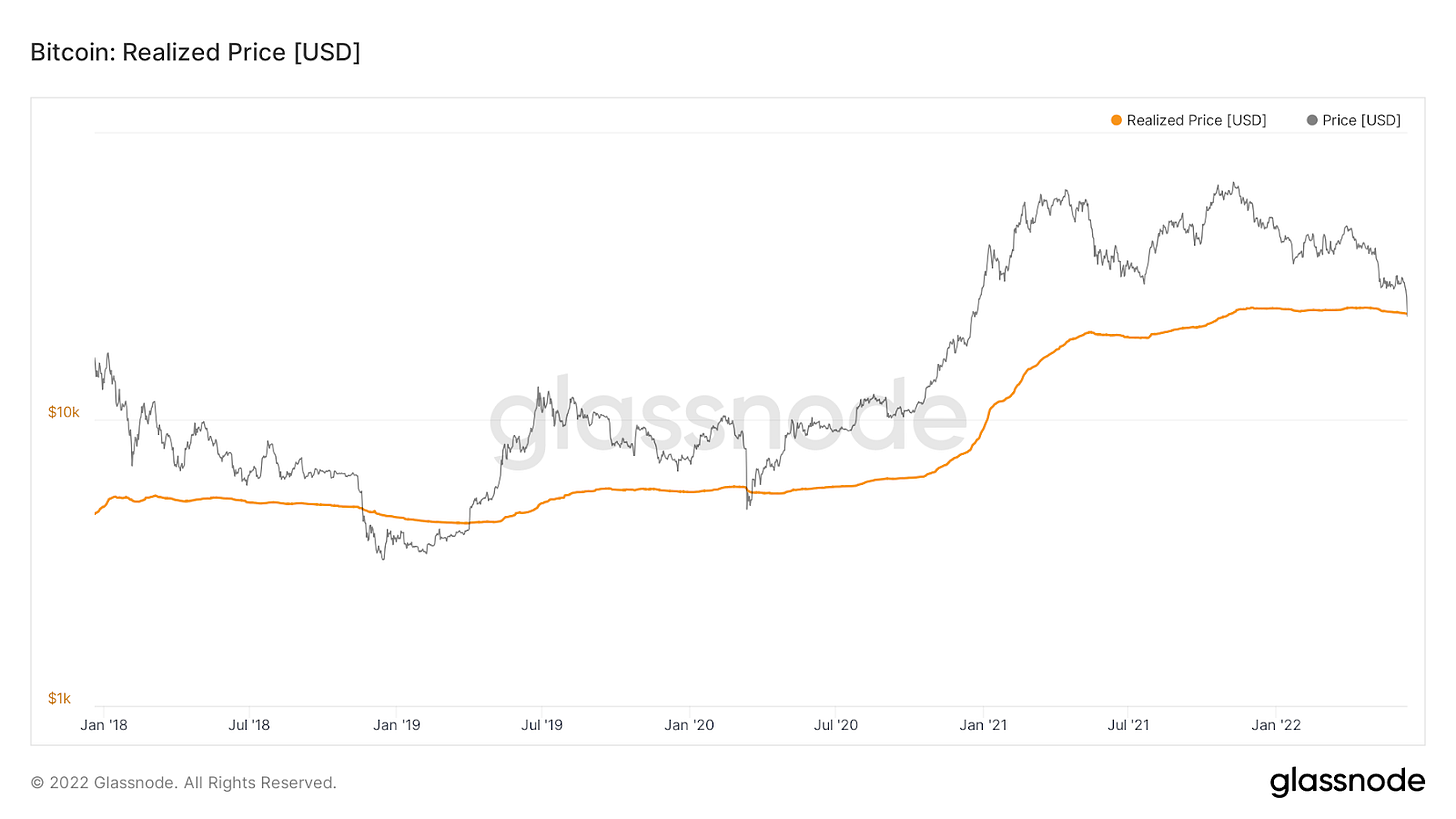
Technical: We failed to hold the $29,500 VWAP support and the $28,500 range support outlined in last week’s newsletter. So now we are on our way to the BTC’s realized price of $22,000. However, I suspect BTC might overshoot that level a bit ($18,000 - $20,000), just like previous times where it came down to the realized price.
Markets: Equity markets are in turmoil after an increase in CPI was reported on Friday, Jun 10. The markets expected a lower CPI number, but it came in at 8.6%, the highest increase since 1981. With this continued increase in inflation, the Fed is less likely to pause rate hikes, and the market is pricing in a possible 0.75% rate hike next month, further causing the decline in equities and crypto markets.
Recommendations: Buy when others are fearful. As outlined in previous newsletters, I would be looking for major coins near the BTC realized price, in the range of $18,000 - $22,000. If you are risk-averse, wait until prices stop declining and start flattening out before entering positions. Creating Grid Bots or Moon Bots is a great option.
Important News
Jun 9: The European Central Bank confirmed its intention to hike interest rates at the policy meeting next month and downgraded its growth forecasts
Jun 10: The consumer price index rose 8.6% in May from a year ago, the highest increase since December 1981
Jun 10: The University of Michigan’s gauge of consumer sentiment fell sharply to a record-low reading of 50.2, down from a May reading of 58.4
Jun 13: Morgan Stanely and Goldman say the equities market has not priced in risks fully. Link
Jun 13: Celsius has stopped withdrawing. Many Twitter users say they may become insolvent and not have enough backing for all the withdrawals. Link
This week, we will keep it short and sweet. This past Friday, we had the lowest reading of Consumer Sentiment since 1978 and the highest reading of the CPI inflation numbers since 1981. These are some historical numbers only seen 4 decades ago. This represents some black swan risks for the markets in the near future. Last week we saw 3 days of back-to-back gap downs in the S&P500 after the CPI numbers, totaling a drawdown of 8.45%. Bitcoin is down 23.31% in the same period. The upcoming FOMC meeting on Wednesday, Jun 15, could mark a change in market direction. However, no matter what the Fed decides to do, just remember that this is the first time we raise rates in a bear market instead of cutting.
Recommendation
Swing Trading (Manual) | hands-on approach
Bitcoin failed to hold the $29,500 support where I recommended having a mental stop. Seeing prices fail to reclaim the $29,500 level should’ve signaled you to get out of this trade. If you followed this rule, it would’ve saved you from the bloody ~20% downside that followed.
Risk-averse (Grid Bot) | 1 - 12 month
Our opened Grid Bot is down 17%, but this fares better than just holding Bitcoin, which would’ve resulted in ~25% drawdowns. As discussed in the previous newsletter, we recommend adding 10% - 20% of your cash position to opening a new grid bot. I would use a lower bound of ~$15,000 and an upper bound of ~$30,000, with 50 - 60 grids. If you are more risk-averse, you can wait until prices stabilize after the FOMC meeting on Jun 15 before opening a position.
Hodler (Moon Bot) | 1 - 3 year time frame
If you believe in Bitcoin for the long run, we recommend adding 10% - 15% of your capital to your Moon Bot. If you don’t have one open, we suggest creating it. If prices reach around $18,000, we recommend adding another 10% - 15% of your capital.
Bitcoin Volatility
Bitcoin’s daily volatility in the past 30 days is 2.86%. Its’ approximate average daily range going back 14 days is $1,819.
Technical Analysis
Last week, we saw a breakdown of Bitcoin’s $29,500 support. After failing its attempt to reclaim the $29,500 level, we saw sellers take control and a rapid decrease in price over the next 2 days. Bitcoin continued to grind down, and the $28,500 range support did not offer actual demand.
For the RSI, we see a temporary bottom when it reaches below 30. This represents a temporary overextension of prices. We have not seen extended periods where the RSI is below 30 and prices keep trending down.
Bitcoin is approaching its realized price of $22,000, a price we have targeted in the past couple of weeks. As seen in previous bear markets, we often break under the realized price, which can be attributed to an overshot by the momentum of fear-driven capitulation. However, the realized price has always indicated a bottom in previous bear markets. I will not say it will have the same result this time because we have the macro headwinds of a recession, Fed rate hikes, and the highest inflation we have seen in 4 decades playing against us.
Fundamental Analysis
From data provided by glassnode, we can see that there have been inflows of 125 million last week into Bitcoin and 19.7 billion into VC funds. This can be seen as institutional accumulation while retail holders are liquidated or shaken out.
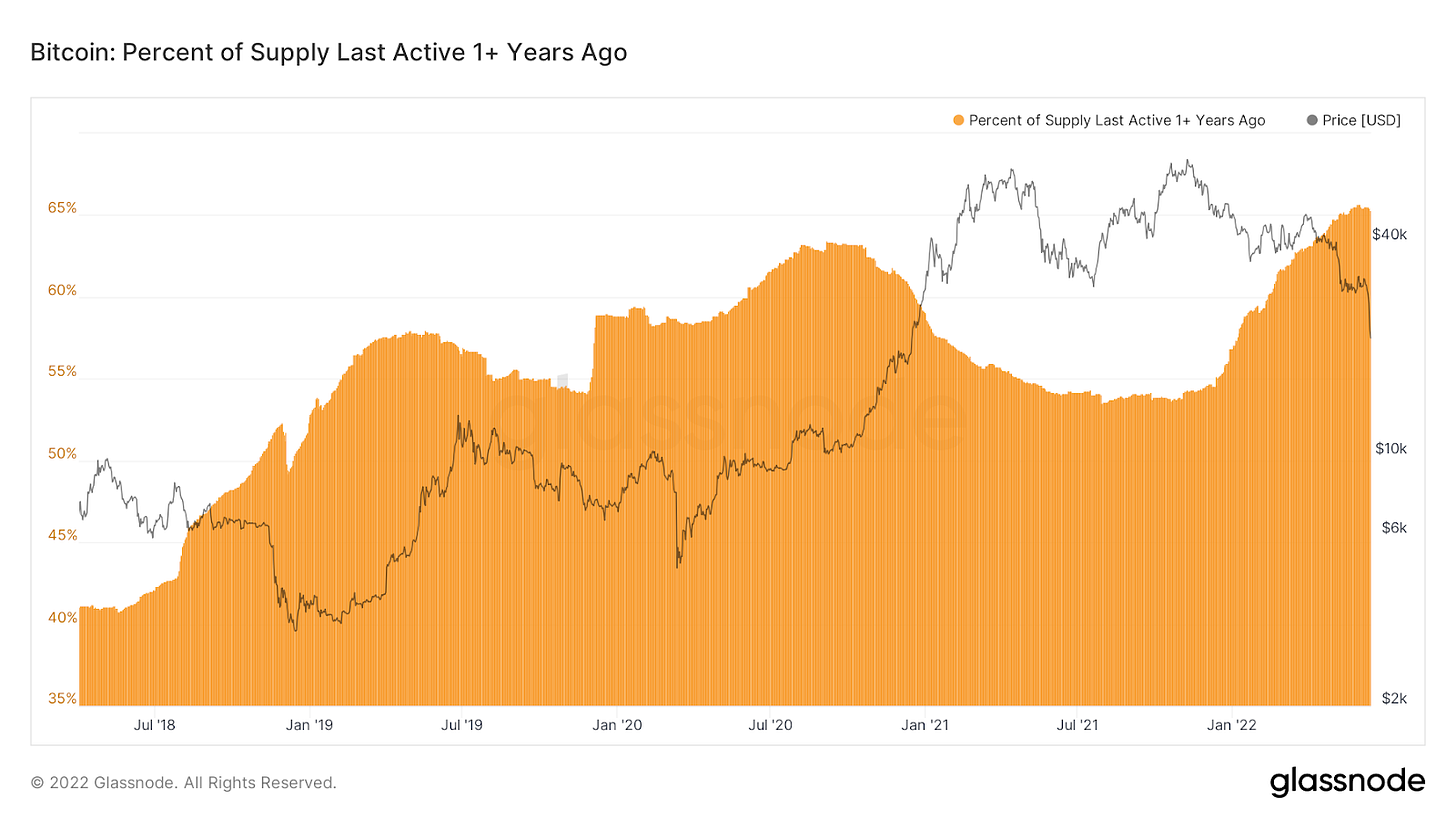
One of the structural differences in terms of Bitcoin Hodlers is starting to emerge. Longer-term holders are still showing their faith in the face of price volatility, and the percent of circulating supply that has not moved for more than one year is still holding strong.
Our Unique View
The Street is Pricing in a Recession
The US CPI in May increased by 8.6% year-on-year and has reached 40-year highs, beating both the previous print of 8.3% and the market’s expectation of 8.3%. People now realize that inflation is still the number 1 problem in the United States and will not disappear in the near future.
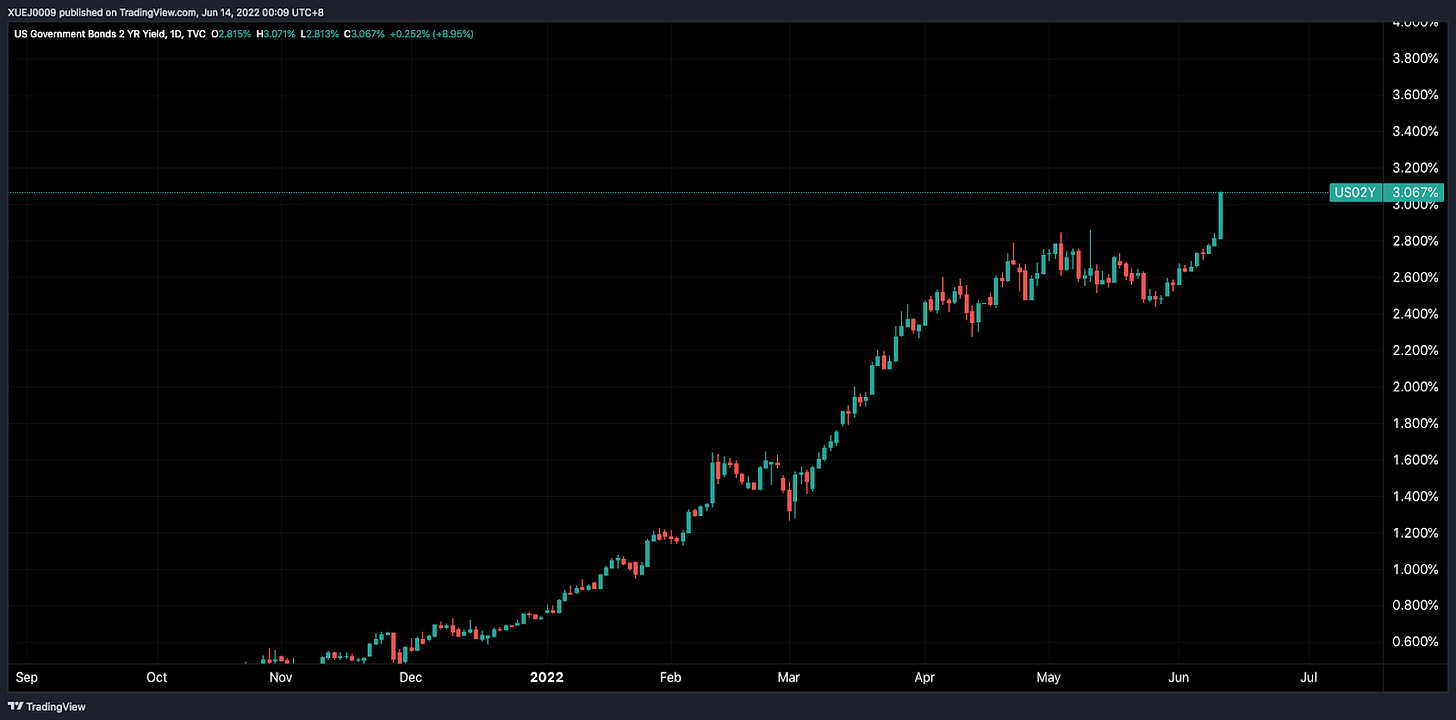
US 2 Year Treasury Yield, Source: TradingView
After the data was released, the two-year U.S. bond yields surged to above 3%, and the market’s expectation of a rate hike in July reached an astonishing 75bps. What’s more, the Fed’s funds rate will top the meaningful 3% threshold by year-end.
Source: CME Fed WatchTool
Now everybody has found that inflation is clearly more resilient than the economy and financial markets at the moment, and the market is currently pricing in a more aggressive tightening cycle for the Fed. It’s possible that the so-called ‘soft landing’ promised by the Fed won’t happen. A more aggressive tightening cycle is likely to bring about a recession. If that’s the case, the market will be pricing in a recession ahead of time, and the liquidity crisis might also return. But no matter what the case, a combination of high inflation plus recession is hard to bear for risk assets.


