

Potentially Market Moving Event
Potentially Market Moving Event
Crypto market analysis, Bitcoin technical analysis and top market events for 7/4 - 7/11

(Any views expressed below are the personal views of the author and should not form the basis for making investment decisions nor be construed as a recommendation or advice to engage in investment transactions.)
Summary (TLDR)
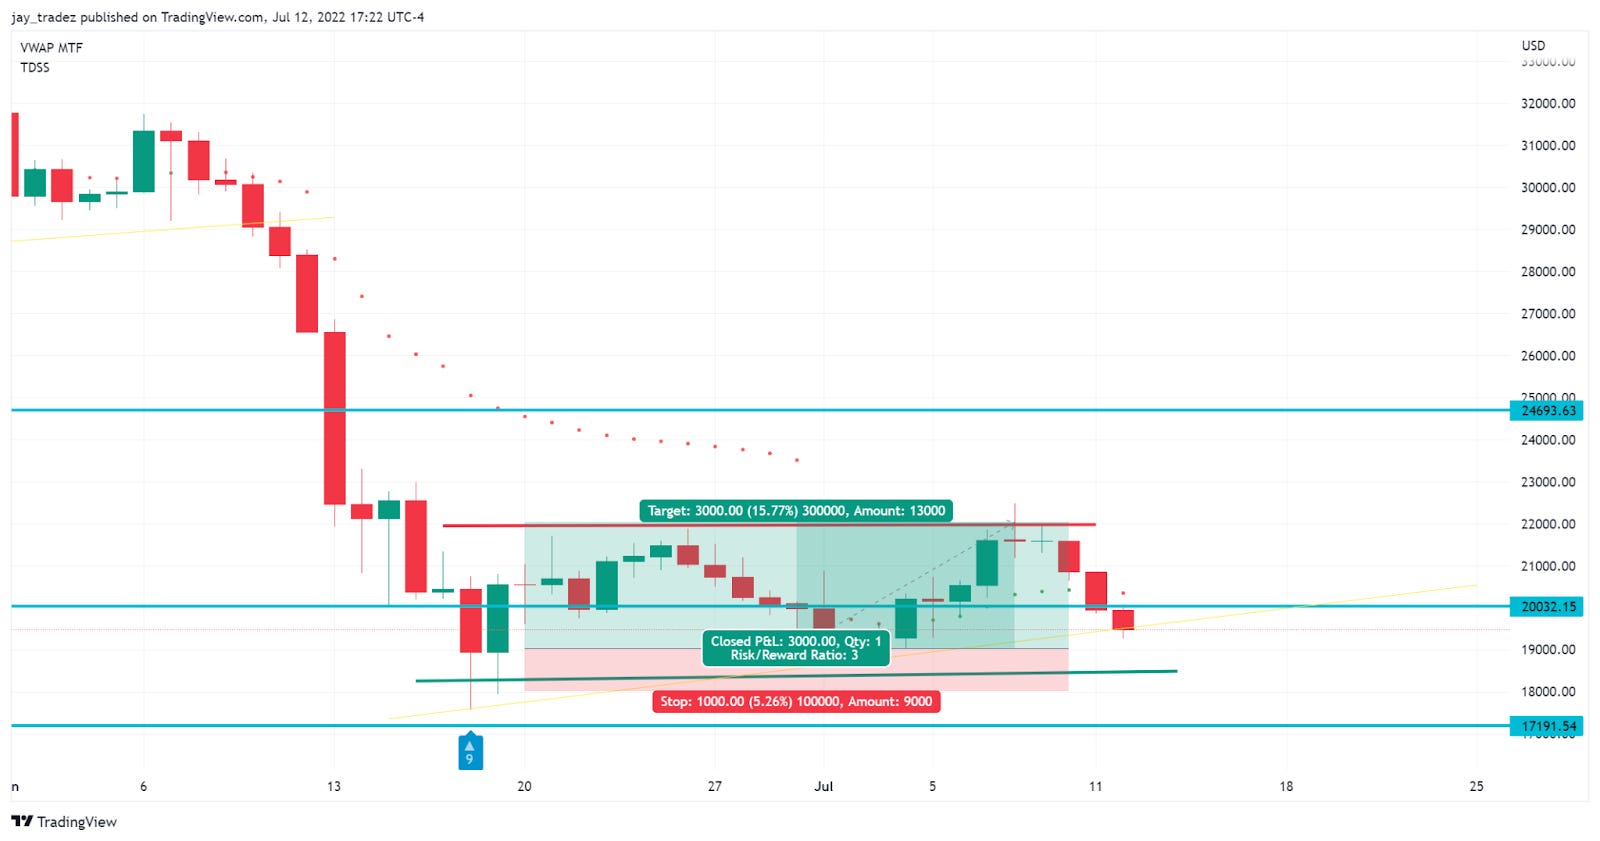
Technical: Bitcoin was rejected by the $22,000 supply zone, as we discussed last week. With the recent price action, Bitcoin’s trading pattern looks almost identical to how it was in May. We are trapped in a trading range, waiting on the July FOMC meeting or other news to drive direction. We are currently at $19,000 and will likely visit $18,000. This confirms the $18,500 - $22,000 trading range that we hypothesized.
Markets: The US dollar (DXY) printed another high on Monday as fears of a recession intensified in Europe. The Euro continues to devalue vs the US dollar as Prime Minster Boris was forced to resign, and heavy inflation mixed in with growth pressures weigh down on its economic outlook. From the FOMC minutes released last Wednesday, we saw that there would be another 50 - 75 bp increase in the next FOMC meeting. The document also said policymakers “recognized the possibility that an even more restrictive stance could be appropriate if elevated inflation pressures were to persist.” The yield curve continues to be inverted for the past week as 10 yr rates fall below the 2yr.
Recommendations: Our swing trade was closed for a 10-20% profit when Bitcoin hit $22,000. The Moon/Grid Bot continues to make profitable trades as prices chop around inside the established trading range. We recommend buying major coins with a moon or grid bot near $18,500 support if you are still all cash. This price action is similar to May when Bitcoin fell 40% after a higher-than-expected CPI print. Tomorrow we will get the previous month's CPI data, so be aware of potential volatile market moves.
Important News
Jul 6: Crypto brokerage Voyager Digital files for Chapter 11 bankruptcy protection. The company has suffered huge losses from its exposure to Three Arrows Capital
Jul 6: Job openings totaled 11.25 million for May, a considerable drop from the upwardly revised 11.68 million in April, according to the Labor Department’s JOLTS report.
Jul 7: According to ISM, the US non-manufacturing PMI fell to 55.3%, down 0.6% from 55.9% in May, marking the lowest number since May 2020
Jul 7: Celsius Network has completely paid off its Bitcoin loan, liquidation price has dropped to $0
Jul 8: US non-farm payrolls growth slowed to 372,000 during June, while the unemployment rate was unchanged at 3.6%
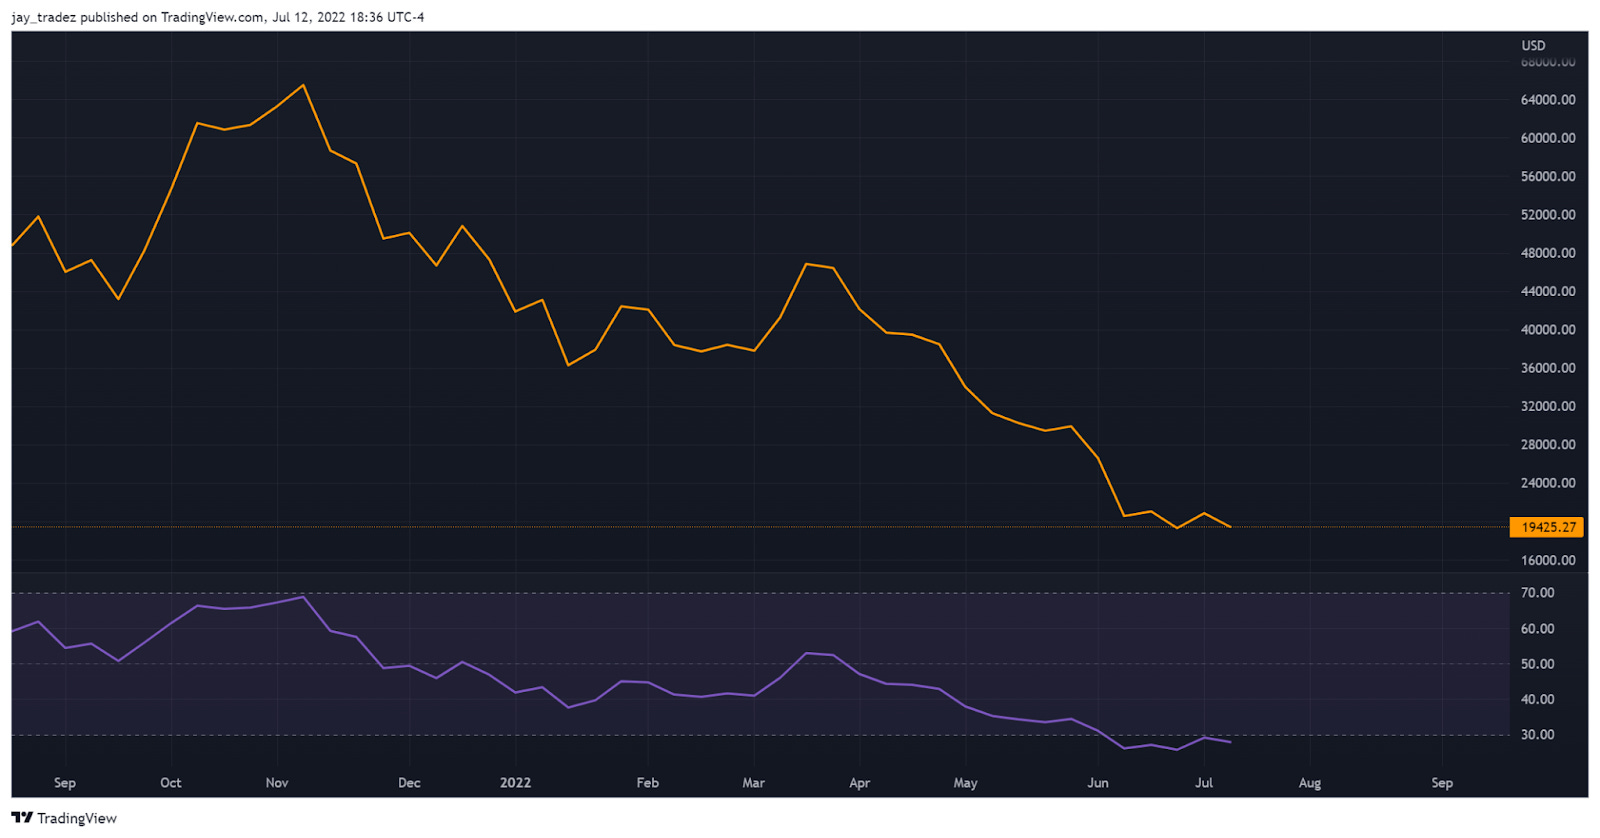
Markets are now down 75% from the previous ATH. With such a big drawdown, everyone from miners to previous cycle holders is under increasing pressure. We will look at some trade set-ups and bottoming indicators to see just how much accumulation we are witnessing today.
Recommendation
Swing Trading (Manual) | hands-on approach
We successfully closed our swing trade this week at $22,000 for a 15 - 20% profit depending on your exact entry. Our original entry was in the $18,000 - $19,000 range two weeks ago, as described in this newsletter. Bitcoin prices hit a high of $22,461, and our revised target of $22,000 was right on the money. This trade initially targeted $24,000 with a 5:1 risk-reward ratio, but the revised target gave us around a 3:1 risk-to-reward ratio. We edited our original target due to increasingly lousy inflation data and the risk of a recession. So without a solid solution to this issue, we will not be too optimistic about any bounces.
One more active trade you could put on is buying when prices reach ~$18,500 - $19,000, stopping out under $18,000 and targeting $22,000.
Risk-averse (Grid Bot) | 1 - 12 month
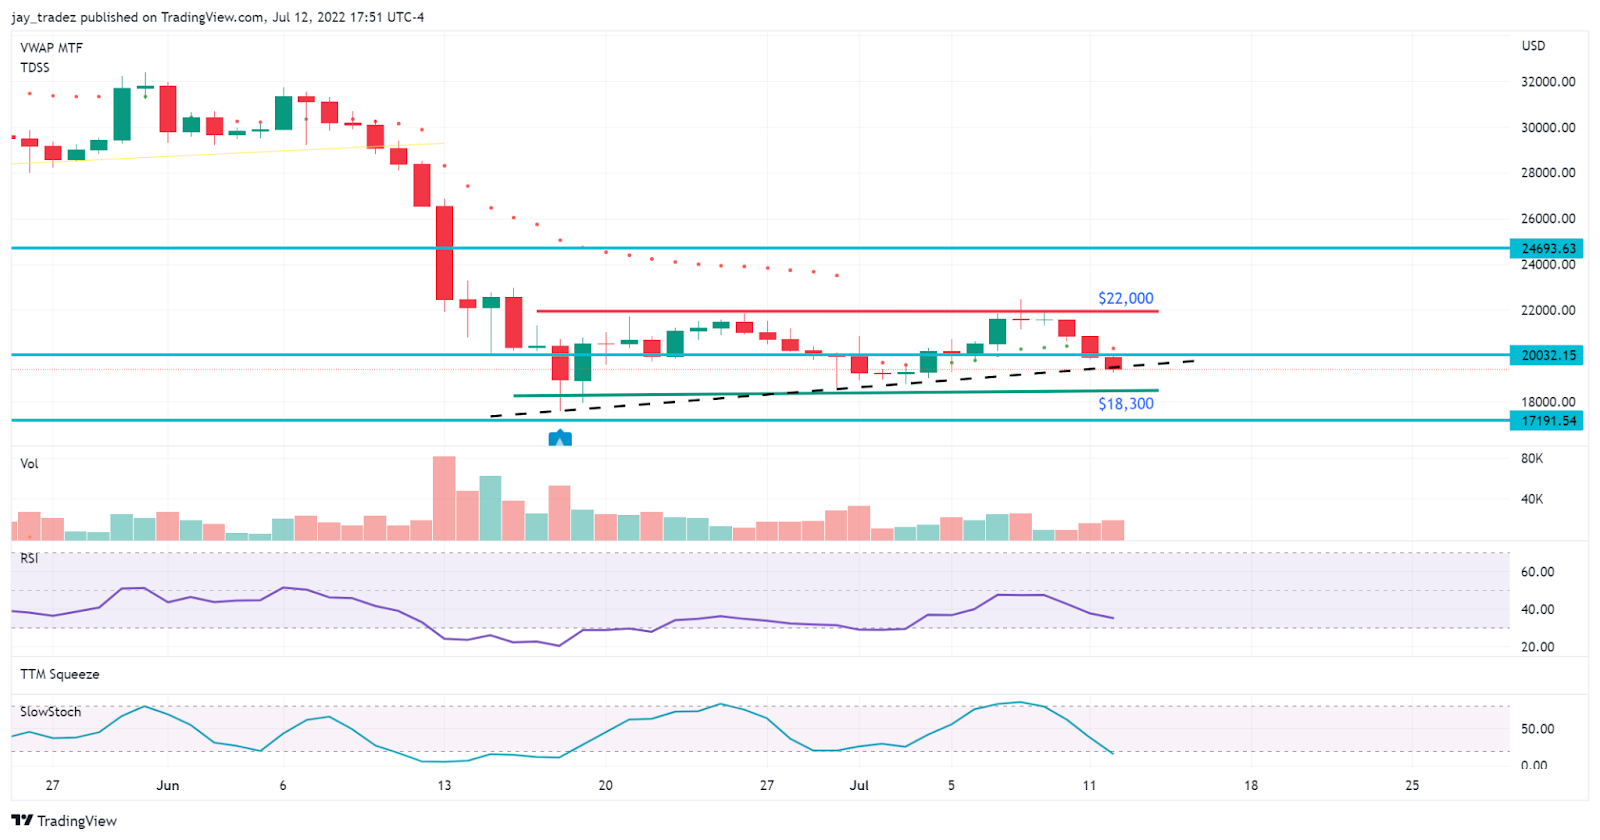
Our opened Grid Bot continues to arbitrage profits during this trading range bringing our grid profits up to 3.56%. This is the perfect environment for a grid bot as it will keep making small profitable trades and effectively lower your average cost. Last week our Grid Bot was at break-even profit, but now it is down 5%. However, we don’t care about the fluctuations in the total profit. The whole idea is to let the Bot run and make trades for us while we focus on other things. If we wanted to trade in and out of short-term price volatility, we would instead be day traders, the opposite idea of a Grid Bot. As discussed in the previous newsletter, if you are still all cash, we recommend adding 10% - 20% of your cash position to open a new grid. I would use a lower bound of ~$15,000 and an upper bound of ~$30,000, with 50 - 60 grids.

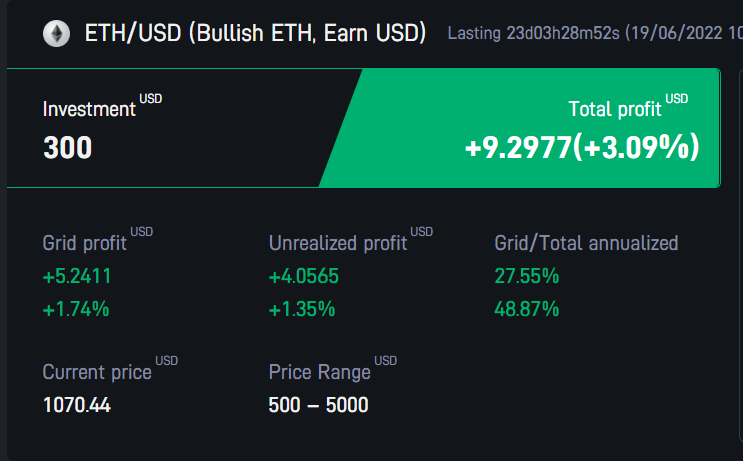
Hodler (Moon Bot) | 1 - 3 year time frame
If you believe in Bitcoin or Ethereum in the long run and are sitting mostly or all cash, we recommend using 10% - 15% of your capital to open a Moon Bot. We plan to hold this long-term and keep adding to our position as prices drop to keep demand levels. Below is our sample Ethereum Moon Bot.
Technical Analysis
Last week we predicted that Bitcoin would most likely reach its upper range resistance at $22,000 and then retrace back into the range. This idea played out almost to a tee. As I said last week, this price action reminds me of the Bitcoin consolidation in May before falling over 40%. The previous 40% drop was caused by a surprise upside in the CPI numbers, which led to heavy selling in the equities market and Celsius halting withdrawals spreading fear in the markets.
We are closely monitoring the CPI data to be released on Wednesday, July 13th. This could be a market-moving event. The consensus estimate is now 8.8% YOY gain, which is higher than the previous 8.6% gain last month. If we get a lower CPI number than 8.8, we have a high probability of making a bullish move. I would be looking at $22,000 as the initial resistance, but most likely, we will see $25,000 as the primary target. Any surprises to the downside on the CPI number would indicate that inflation is slowing down, leading to the Fed not needing to raise rates as quickly, putting less pressure on the markets.
The weekly RSI is still under 30, representing that we are still very oversold even with the recent 15% increase to $22,000. I will keep this on watch to see if the CPI data can push this metric over 30, indicating strength returning to the Bitcoin market.
Fundamental Analysis
Miner Capitulation
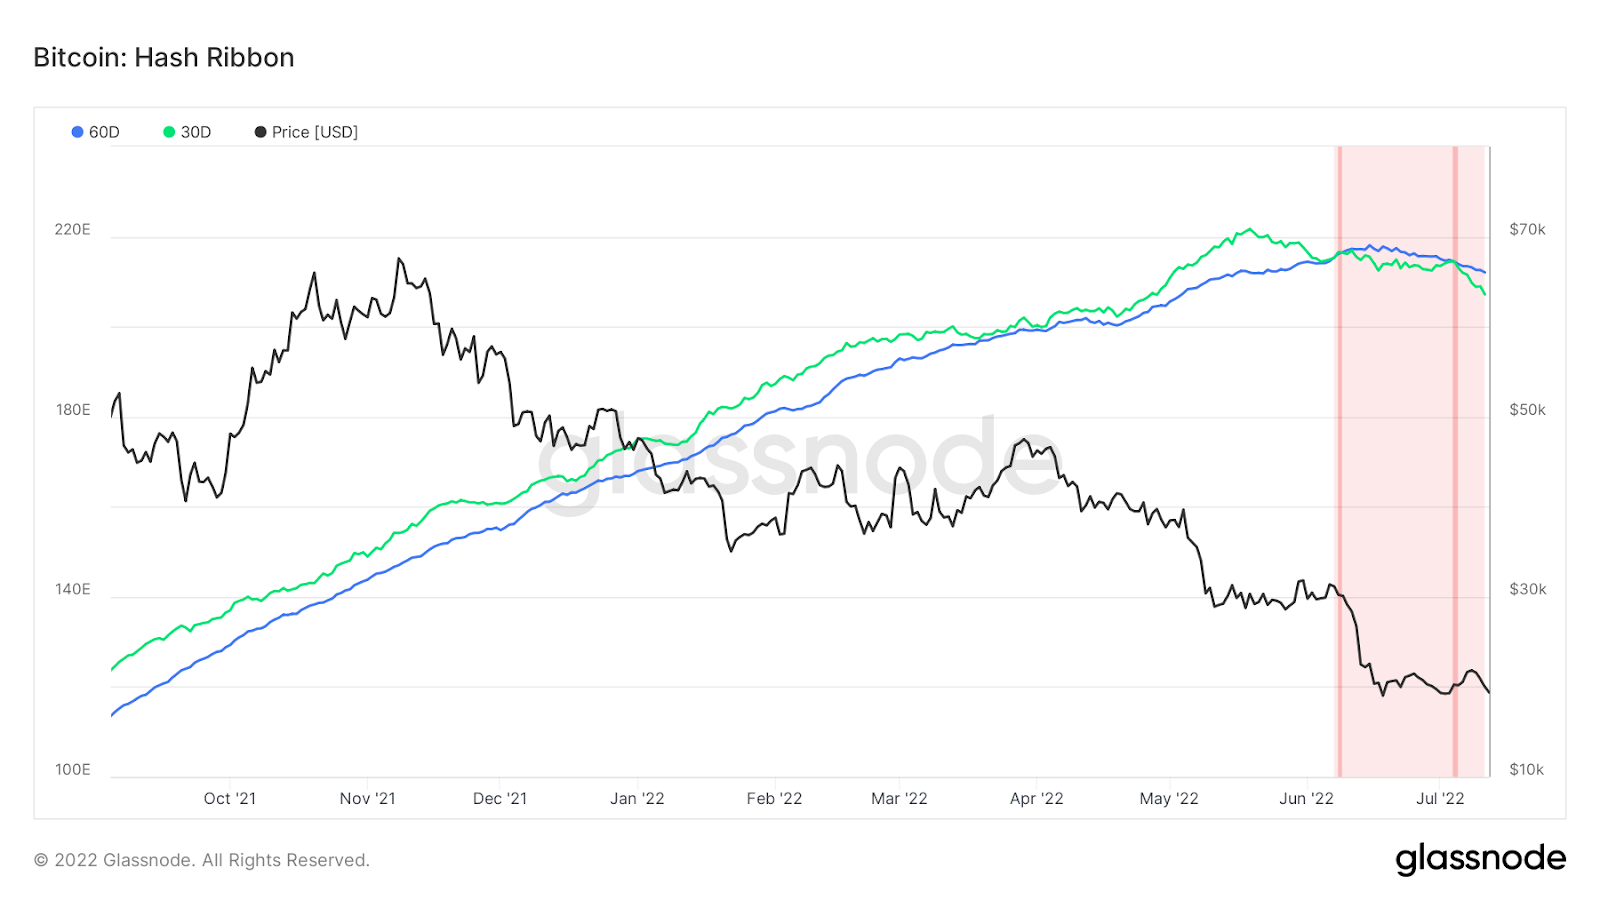
Miners have been selling their Bitcoin inventory starting in early May due to Luna blowing up and the downward pressures on Bitcoin. In early June, miners began to turn off older ASIC mining machines as they became unprofitable. This can be seen through the hash-ribbons crossing to the downside (highlighted in red). Miner capitulation usually marks an incoming bottom in Bitcoin, and in the past 3 months, we saw them selling a total of ~4.5k BTC in May, ~2k BTC in June, and 1.35k BTC in July.
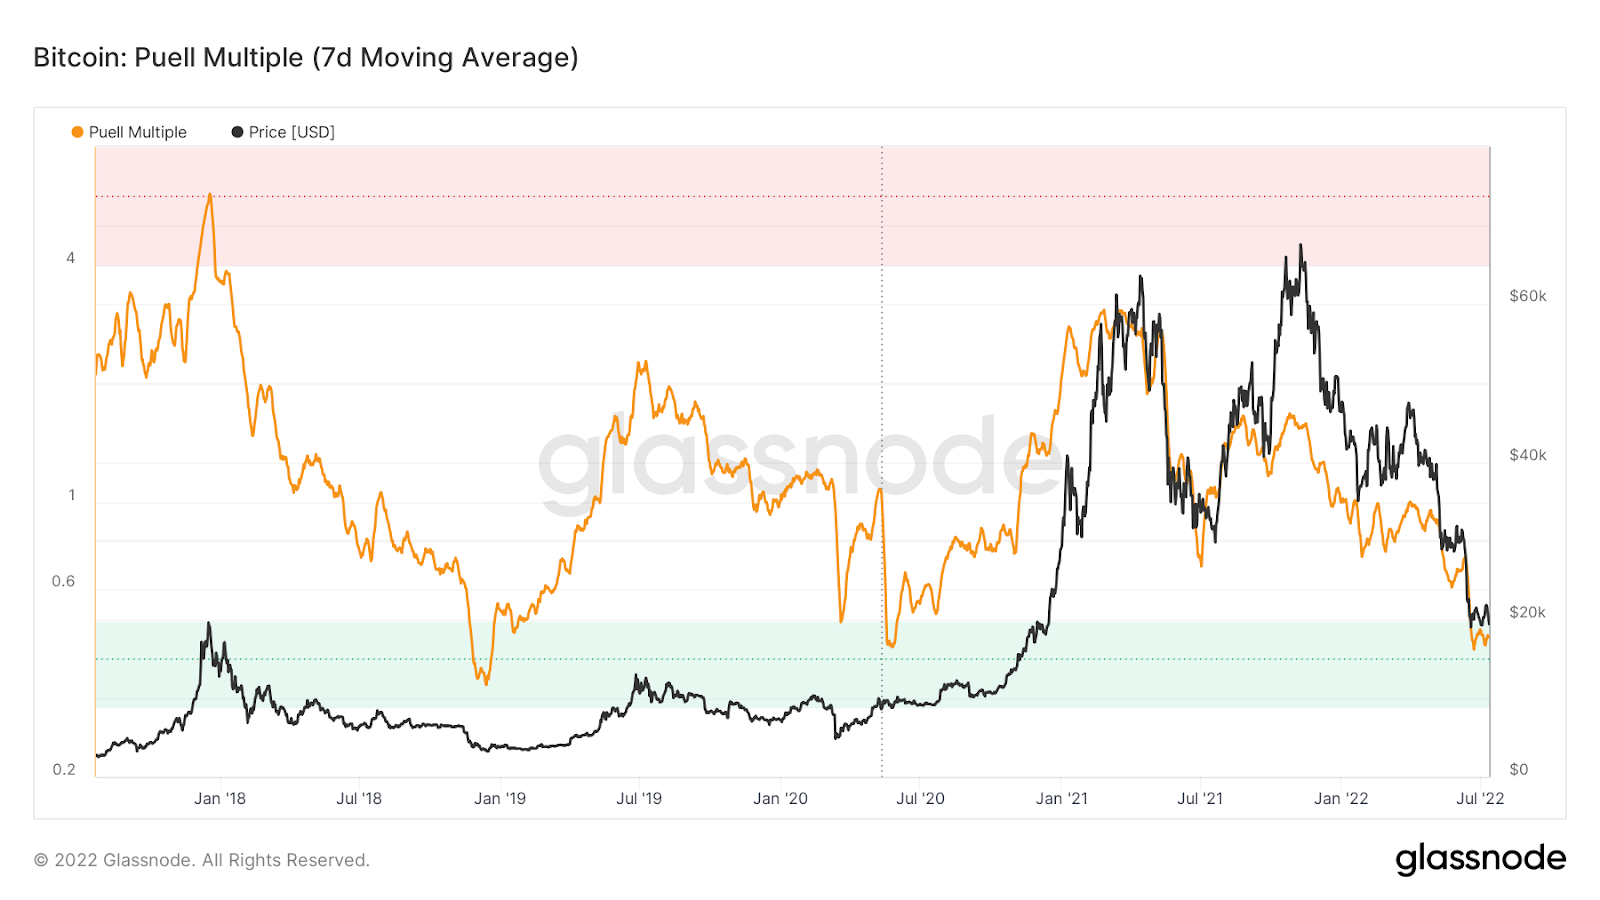
The Puell Multiple below shows the average miner income in USD compared to its 1-year average. Currently, we are at a 0.45 on this metric, showing miners are making 45% less than the yearly average. So as Bitcoin prices fall, miners get increased income pressure on their production, causing them to sell their inventories.
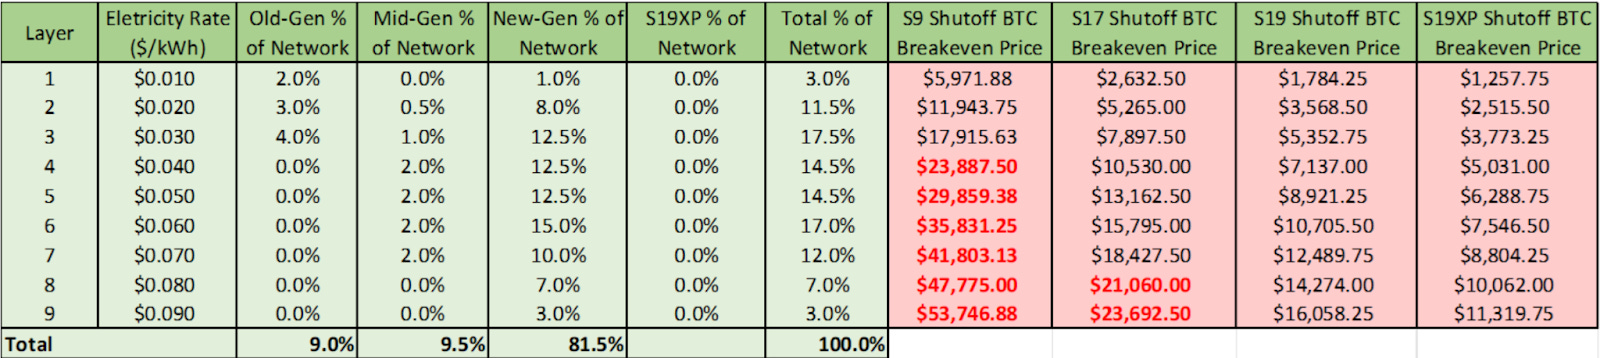
Lastly, we look at the updated Bitcoin miners profitability data table provided by blockware. We can see the most popular miners, the S17 and S19, have around a $10,000 - $13,000 breakeven price with an average electricity rate.
Liquidity Vacuum and a Potential Volatility Surge

The percent of Bitcoin’s circulating supply that has stagnated for at least a year hit an all-time high on June 1. It declined slightly and has barely moved since June 17. It is in a state of horizontal movement with low volatility for more than 20 days. It’s proof of low liquidity, meaning big price movements might come after this liquidity vacuum.

Moreover, we also see a decline in BTC monthly implied volatility, and the number is slipping into a relatively low range of 70~75. This means market sentiment is cooling down temporarily, further validating that potential significant price movement is in the cards.
Our Unique View: Trade on Inflation, not on Recession
A Closer Look at The Jobs Data
The US Federal Reserve has its dual mandate, one part is to maximize job creation, and the other is to ensure price stability. The latest print of the unemployment rate stands at 3.6%, 0.1% above the pre-pandemic low level, and it tells us that employment isn’t the issue for now. As a result, the Fed will do whatever it takes to bring down inflation, as we expressed before, even if the economy is at stake, meaning employment data could start to be uglier.
To look closely at the labor market, we focus more on non-farm payroll numbers, a leading unemployment indicator. The labor market can be considered very strong if the non-farm payroll remains above 200,000, while U.S. non-farm payroll growth turned out to be 372,000 during June on Friday.
There had been concerns that during a super tightening cycle, the economy could slow down more sharply and even slip into recession. Friday's labor data temporarily eased those fears and sharply raised the odds that the Fed will continue raising rates aggressively by 75 bps in July’s meeting.
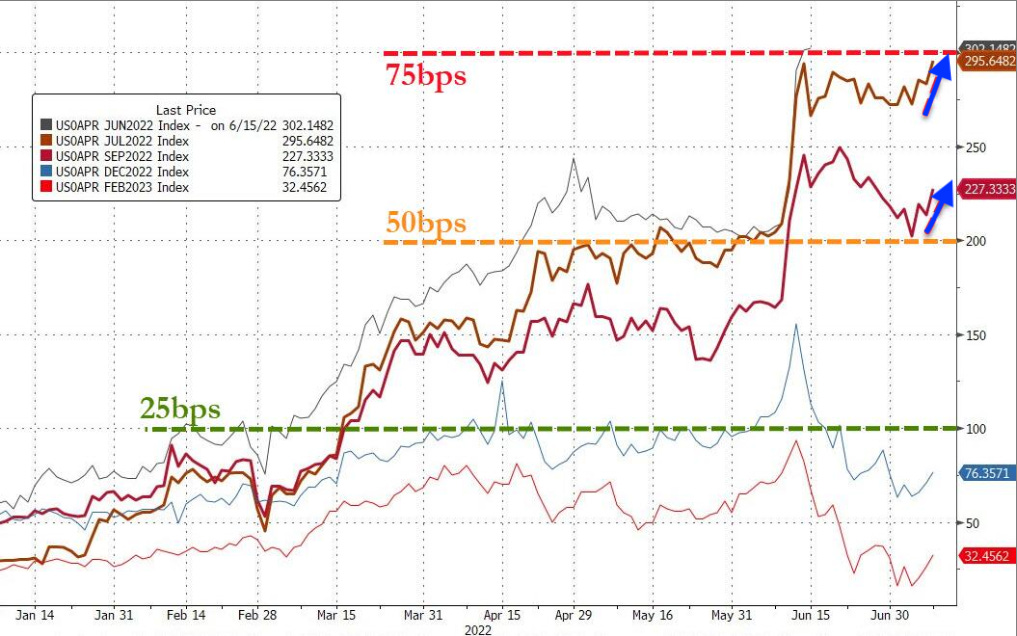
Friday's data raised the odds that the Fed will aggressively raise rates by 75 bps in July.
All Eyes on Inflation
We believe it’s the right time to talk about recession, but it is still too early to trade on a potential recession. The labor data somehow eased fears of a recession, but it does not reduce the fear of further tightening by the Fed. From a macro perspective, we think at least two conditions should be met if the market can hit an absolute bottom and reverse.
Firstly, any indication that inflation has peaked, such as a decreasing CPI number. Secondly, the Fed talks about not raising or lowering interest rates. Everyone from central bankers, traders, and broad investors anxiously waits for any marginal change in inflation data, and payrolls/economy are taking the back seat. Now traders are still pricing in that rates will hit the top at year-end at around 3.5%. Plus, as previously mentioned, the CPI data which is about to be released on Wednesday.
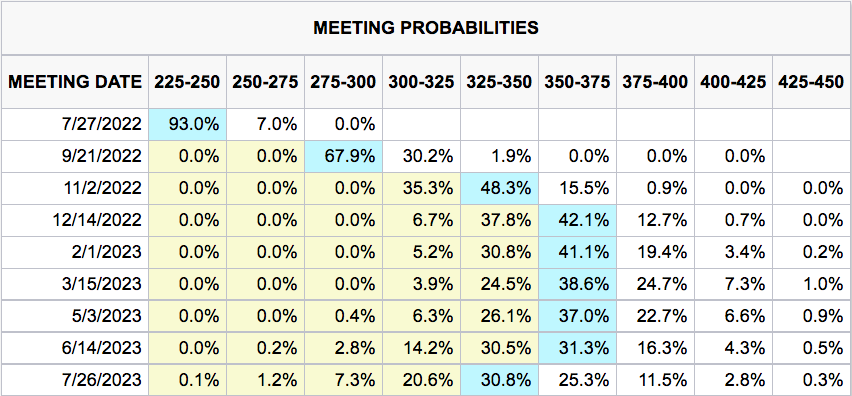
Source: CME FedwatchTool
https://www.cmegroup.com/trading/interest-rates/countdown-to-fomc.html
Thanks for the provided information. This is one of the things I look forward to reading every week.